


01 PROJECT DESCRIPTION -
This piece is inspired by the phenomenal contributions diatom algae bring to our world. Diatoms are light-absorbing molecules that convert light energy from the sun to chemical energy through photosynthesis. In the process, carbon dioxide is removed from the atmosphere, converted into sugar, and oxygen is released. In addition, diatoms are a major source of food for aquatic life on earth. Therefore, this piece aspires to celebrate diatoms as essentials organisms to our whole ecosystem.
02 DESIGN PROCESSES -
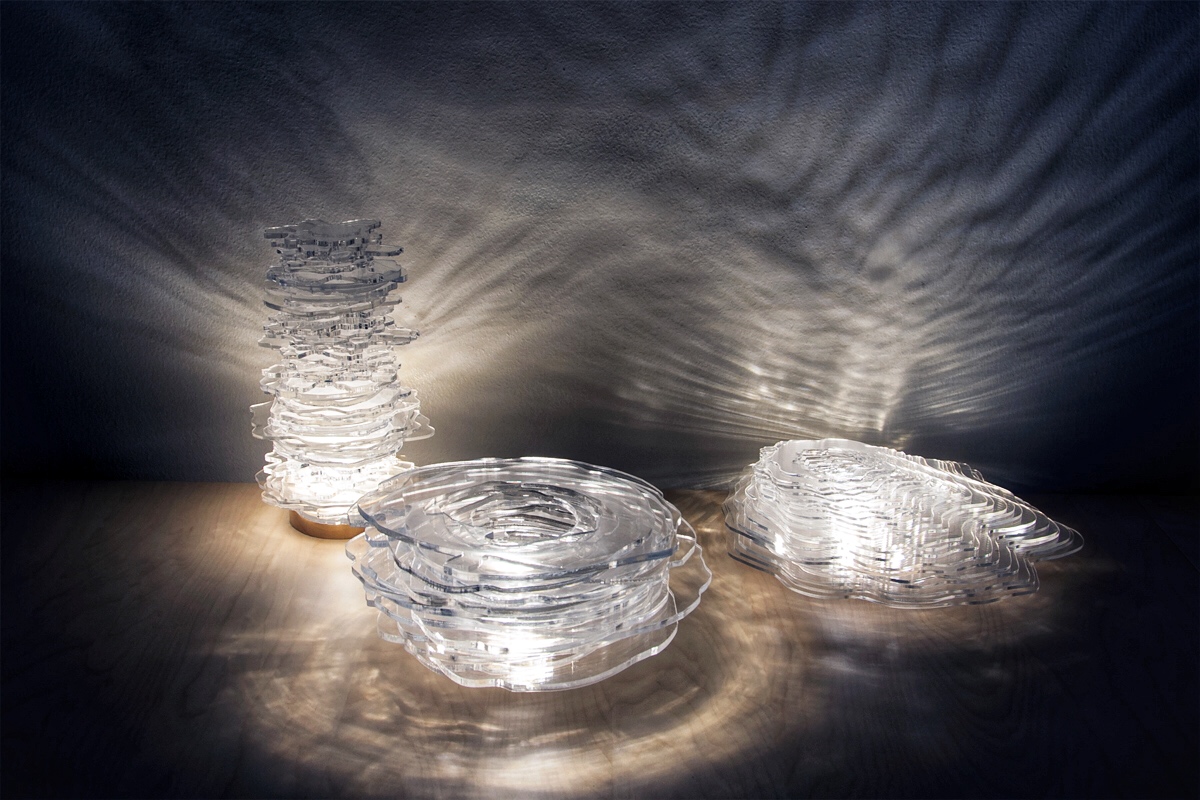
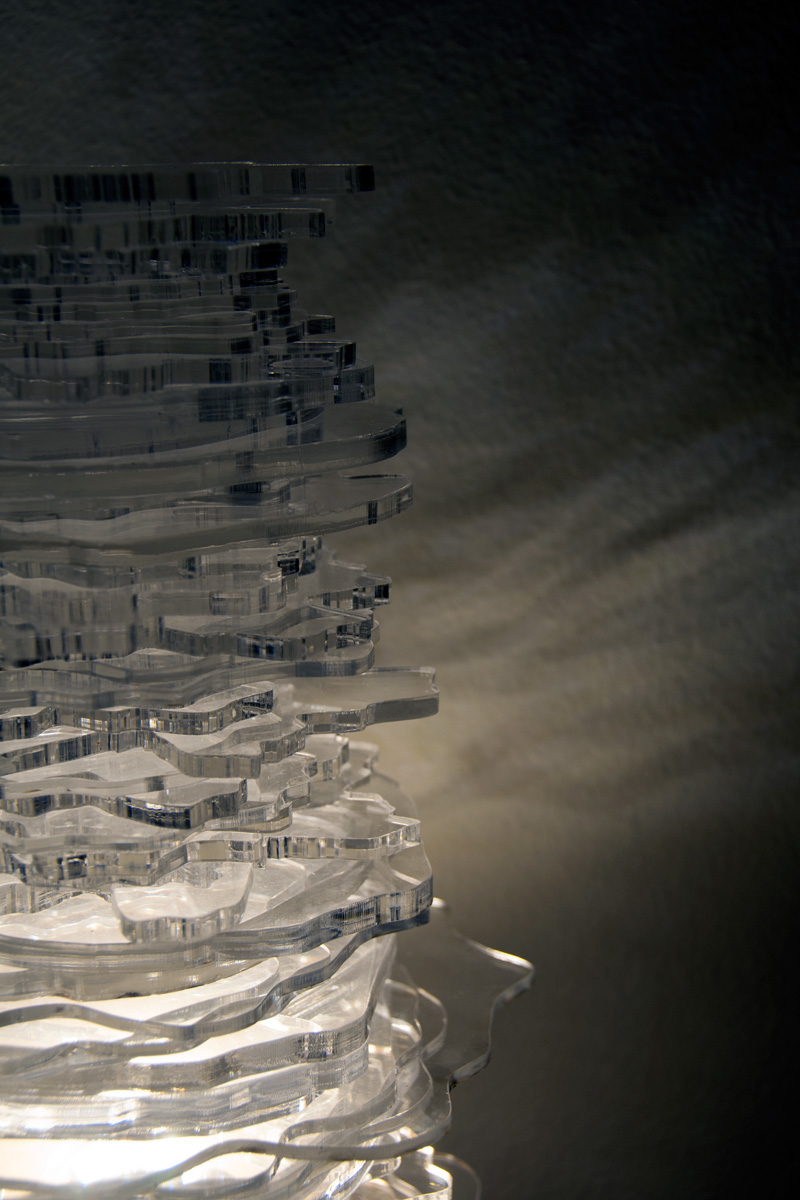
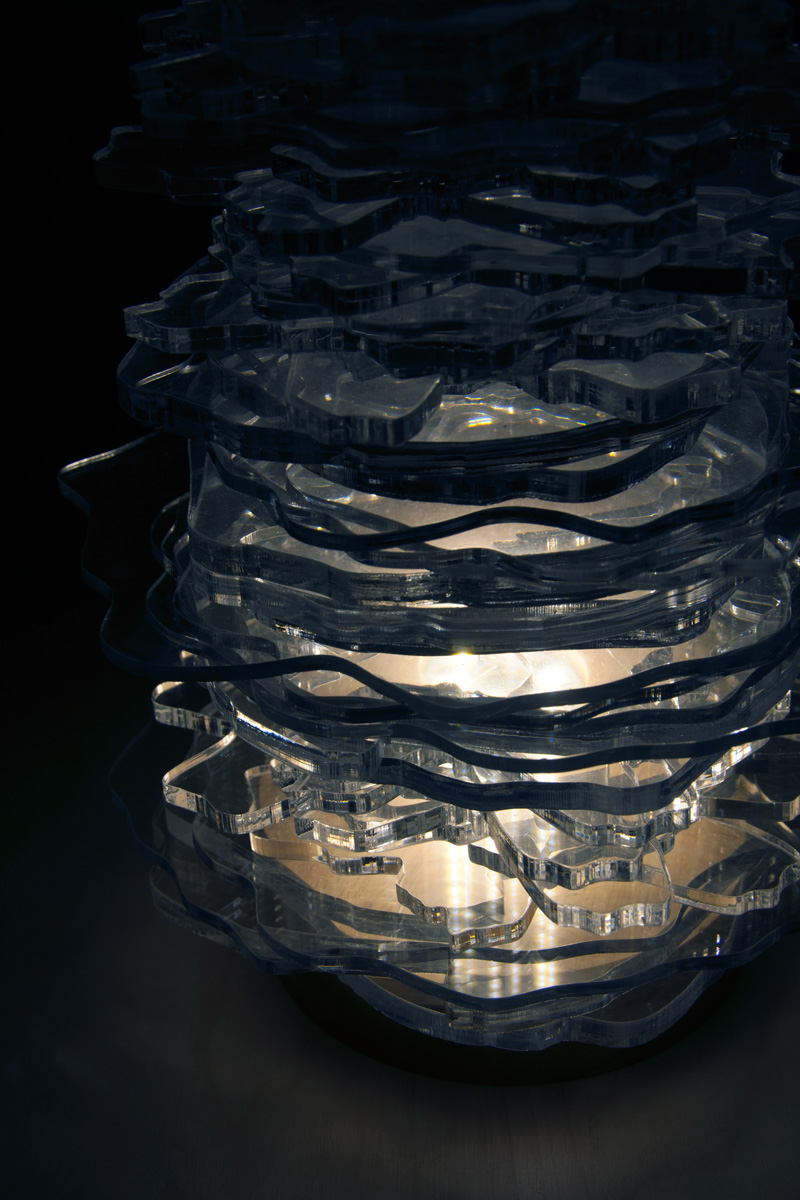
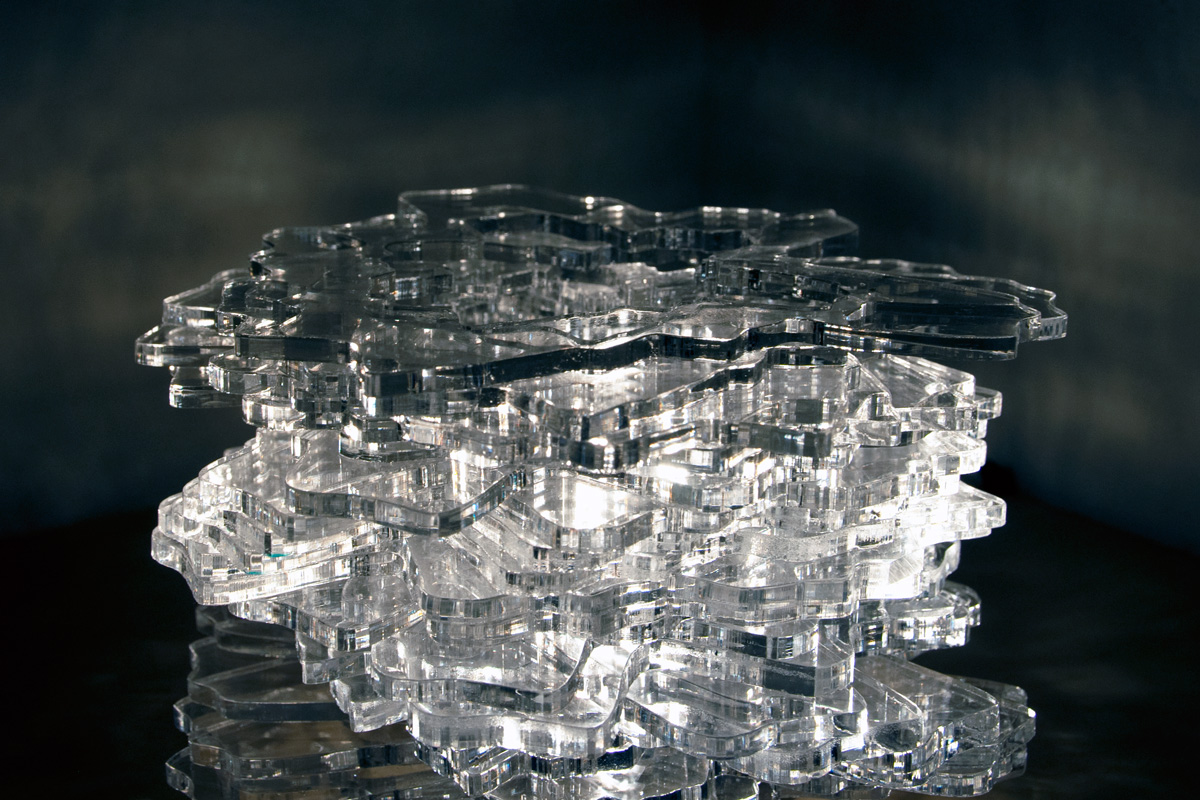
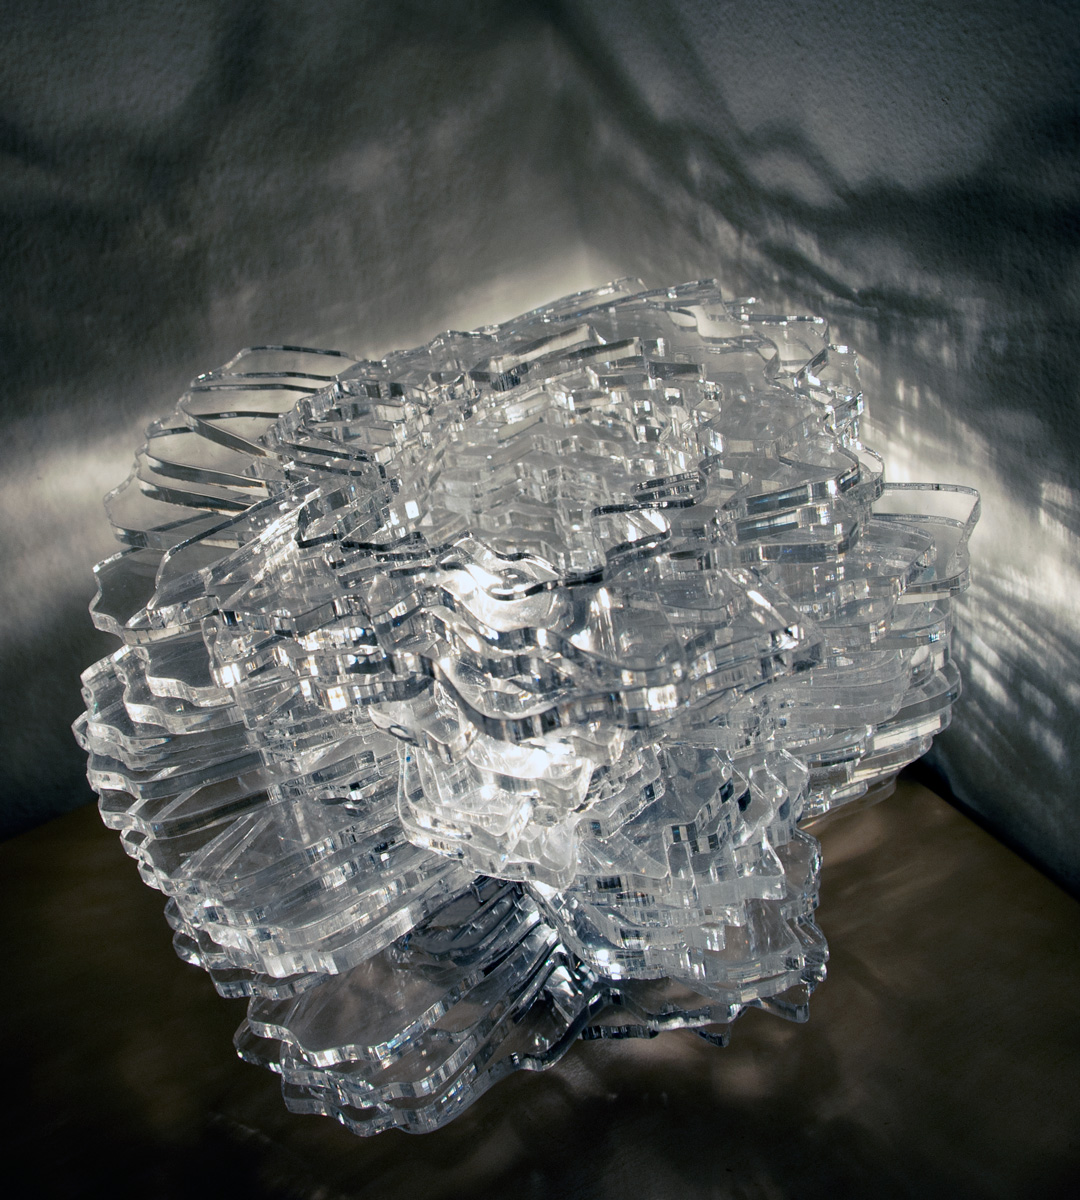
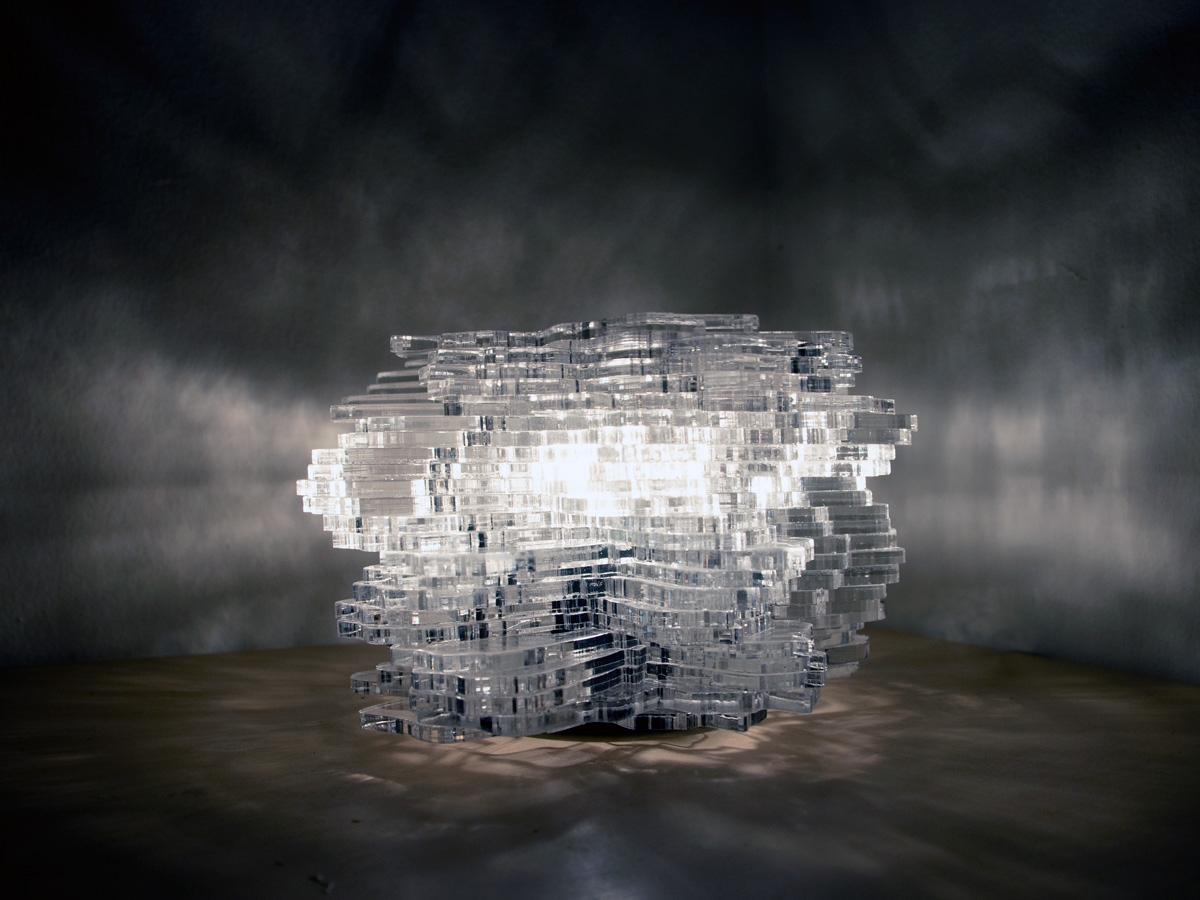
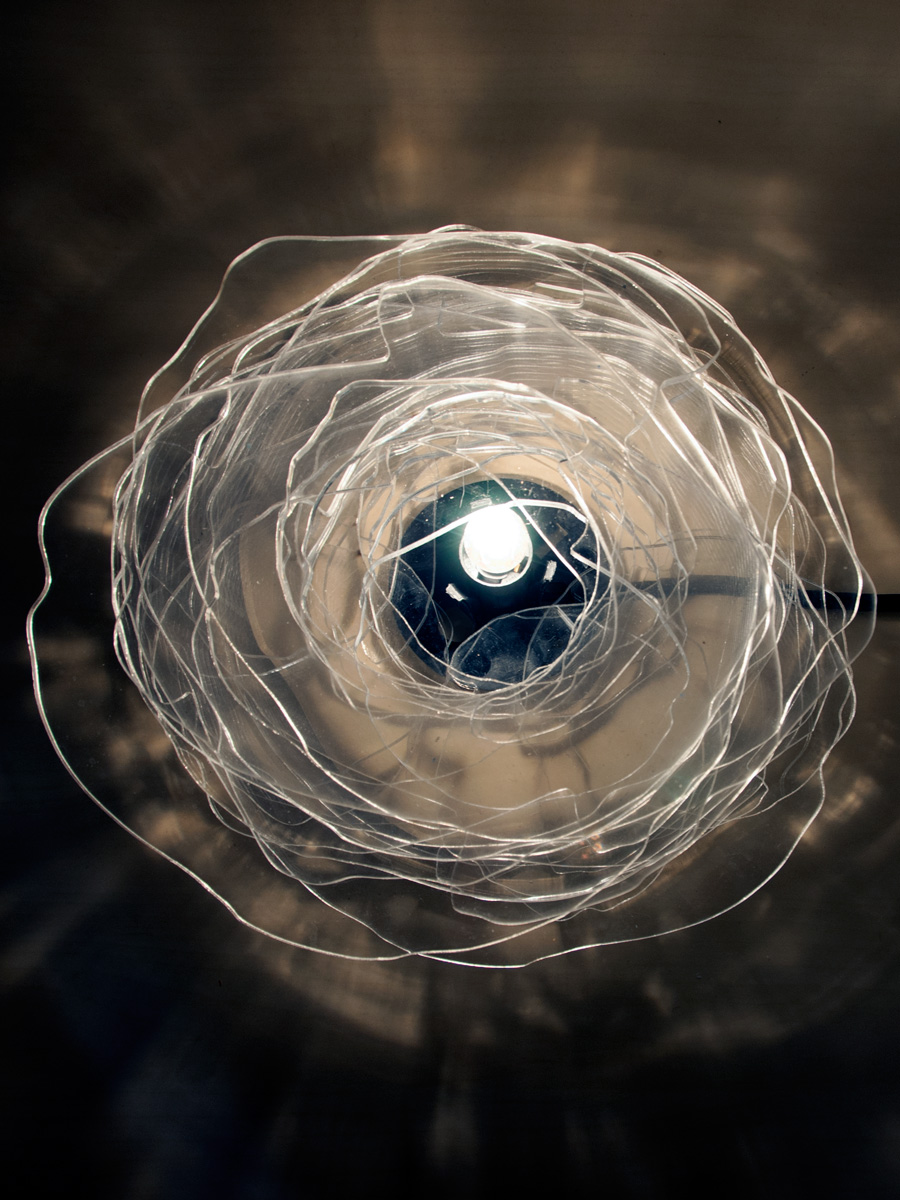
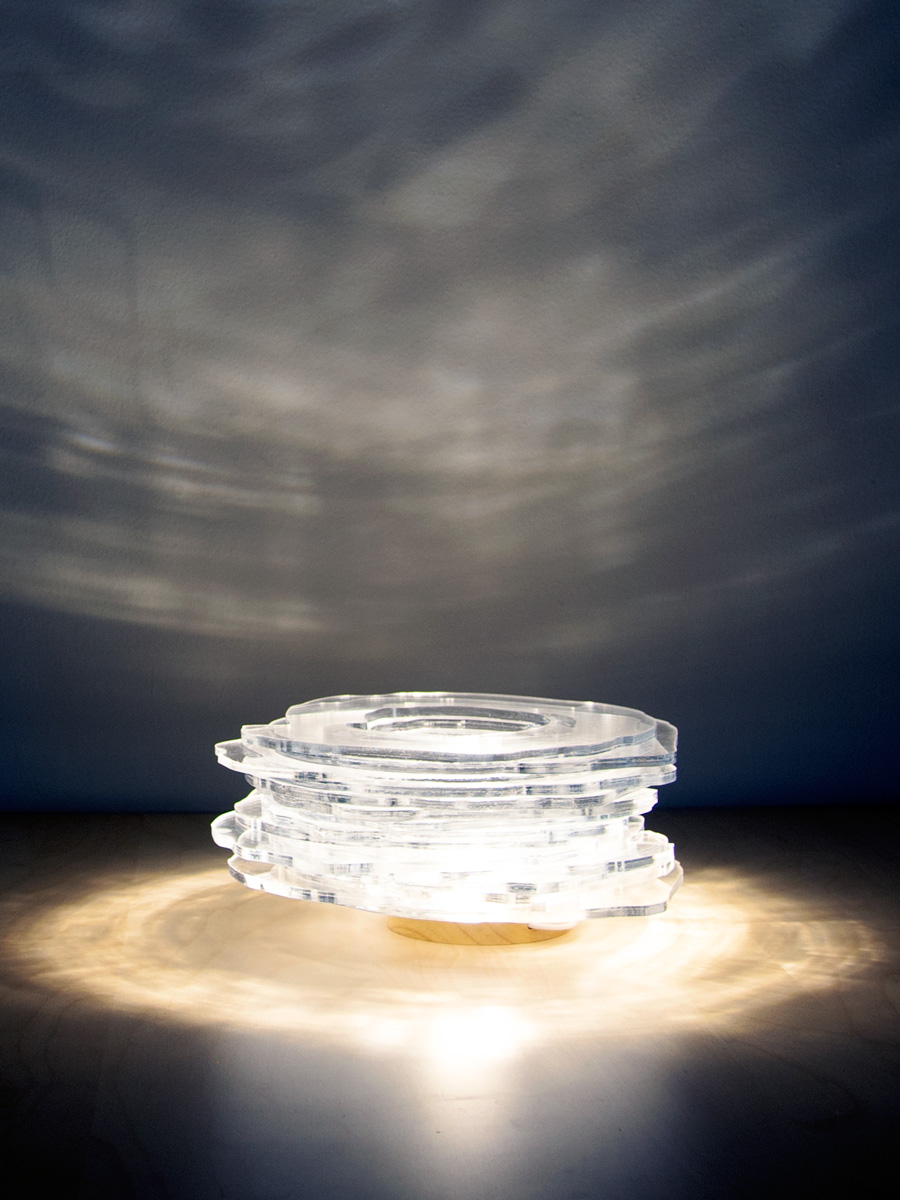
The layered outlines are first generated based on research data from diatom structures. The outlines are then transformed into three-dimensional structure based on diatom wall structure. The outlines are laser cut onto acrylic glass. Layers of cut acrylic glass are then algorithmically layered on top of each other to create the final physical light structure.

(Photograph) courtesy of the U.S. Geological Survey
03 DELIVERABLES -
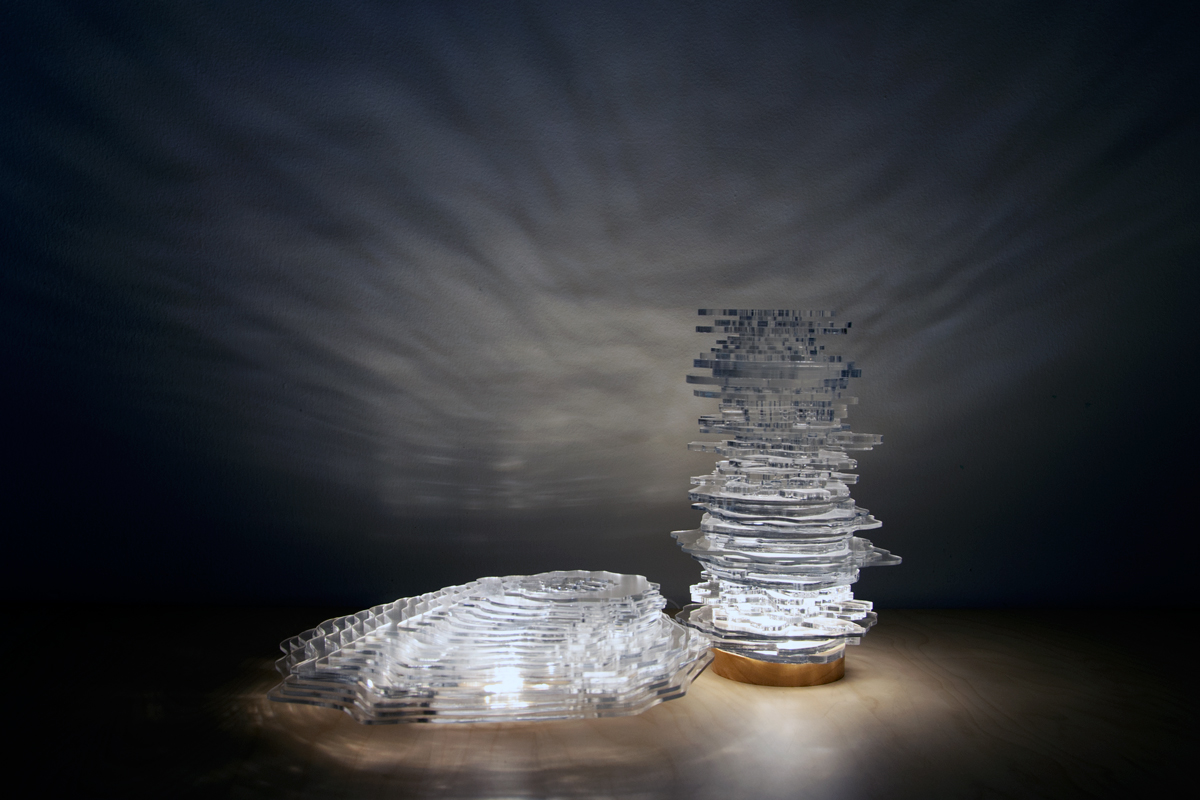
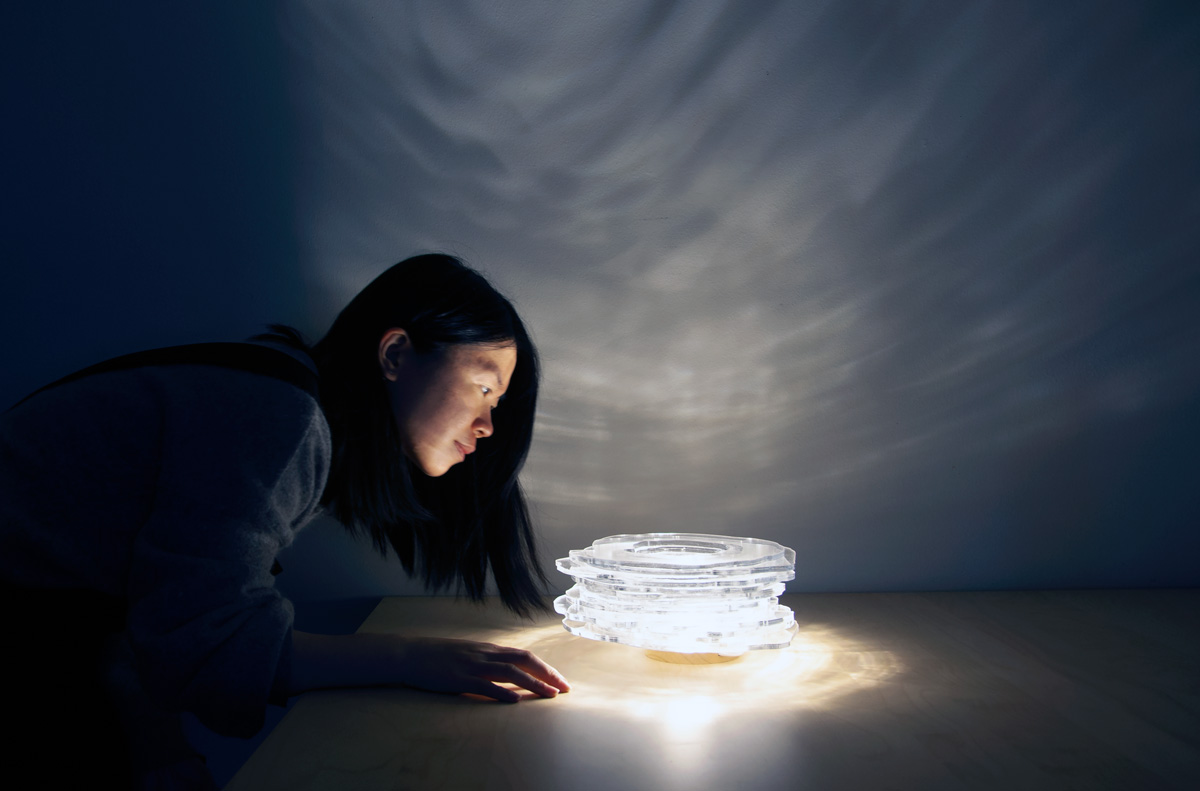
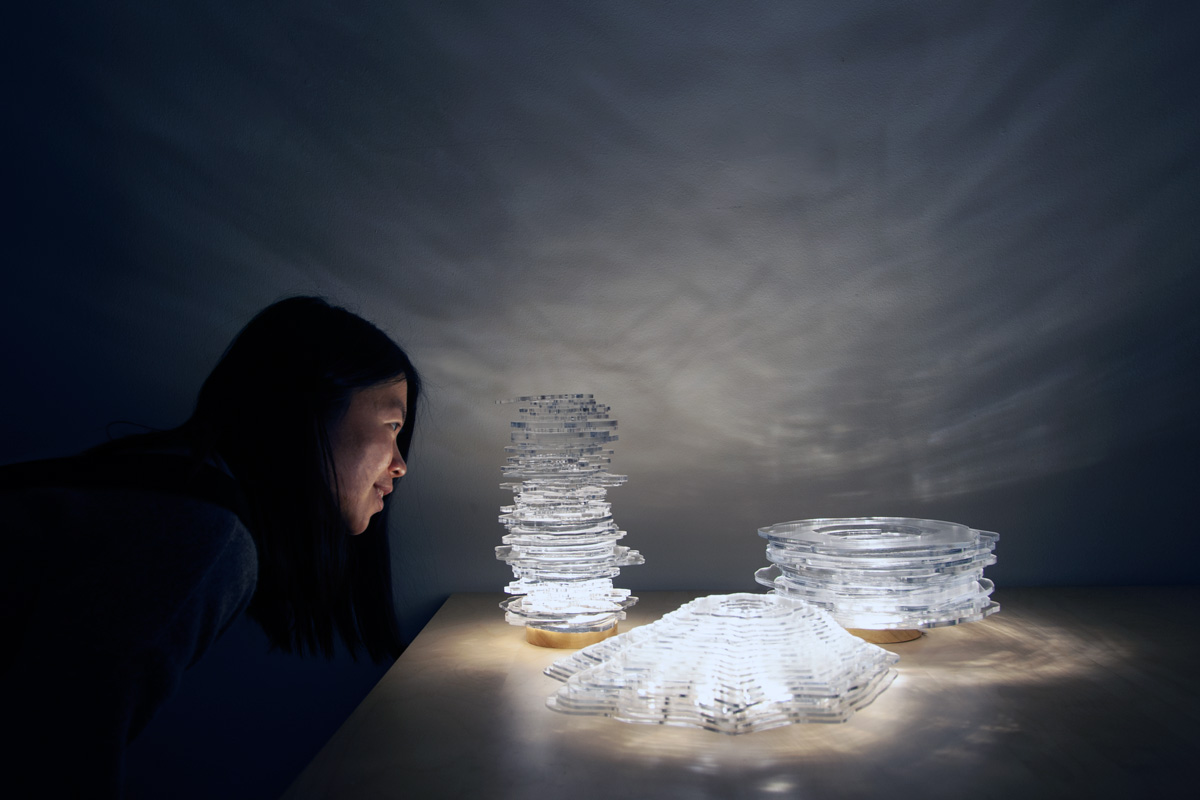
Diatom involves generating a series of molecular outlines based on detailed analysis of diatom's geometric structure. I transform and abstract the data into generative outlines through constructing a series of equations and formulas. Through algorithmic simulation and manipulation, the outlines are layered on top of each other based on diatom wall formations. The final visualization is in the form of light as diatoms convert light energy into chemical energy for other organisms' consumption.
Diatom I
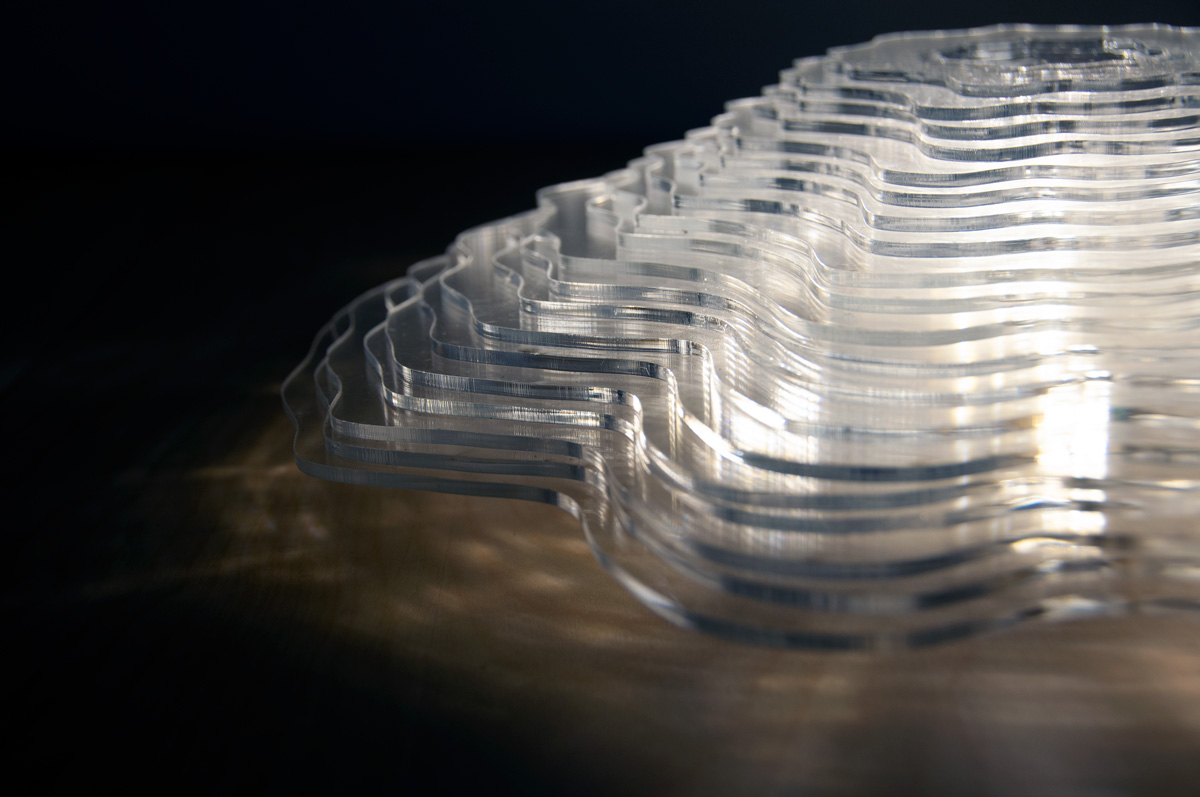

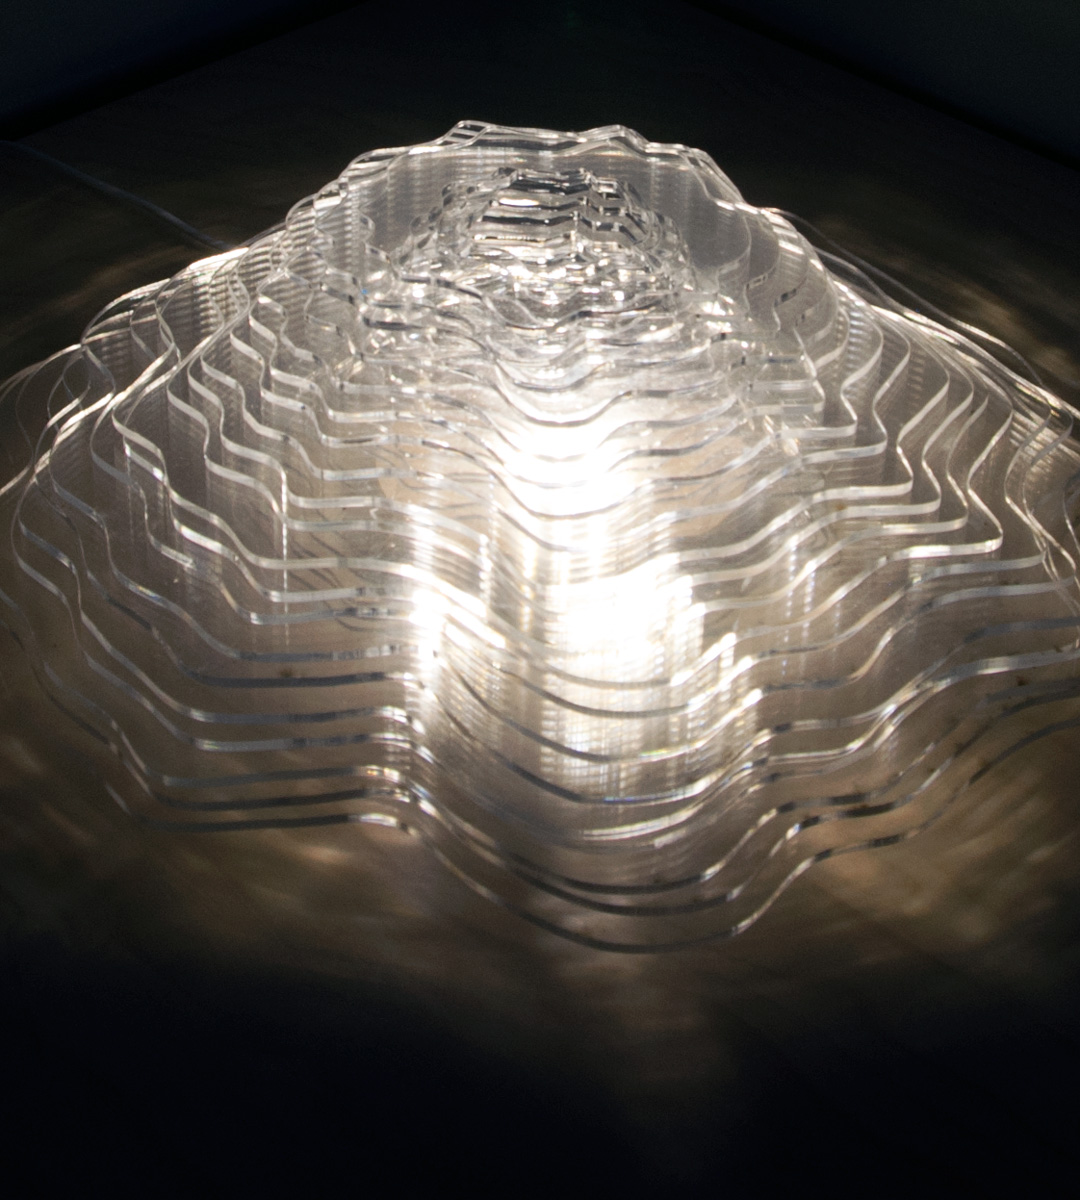


By collecting data such as the distance and angle between each wall structure, I then transform and abstract the data into generative outlines through constructing a series of equations and formulas. Through algorithmic simulation and manipulation, generative forms based on the data gathered and also equations constructed. The data are then entered into laser cut machines to produce different layers of cut shapes. Finally, different cut layers are then layered on top of each other based on algorithms.
Diatom II


Diatom III


Diatom IV


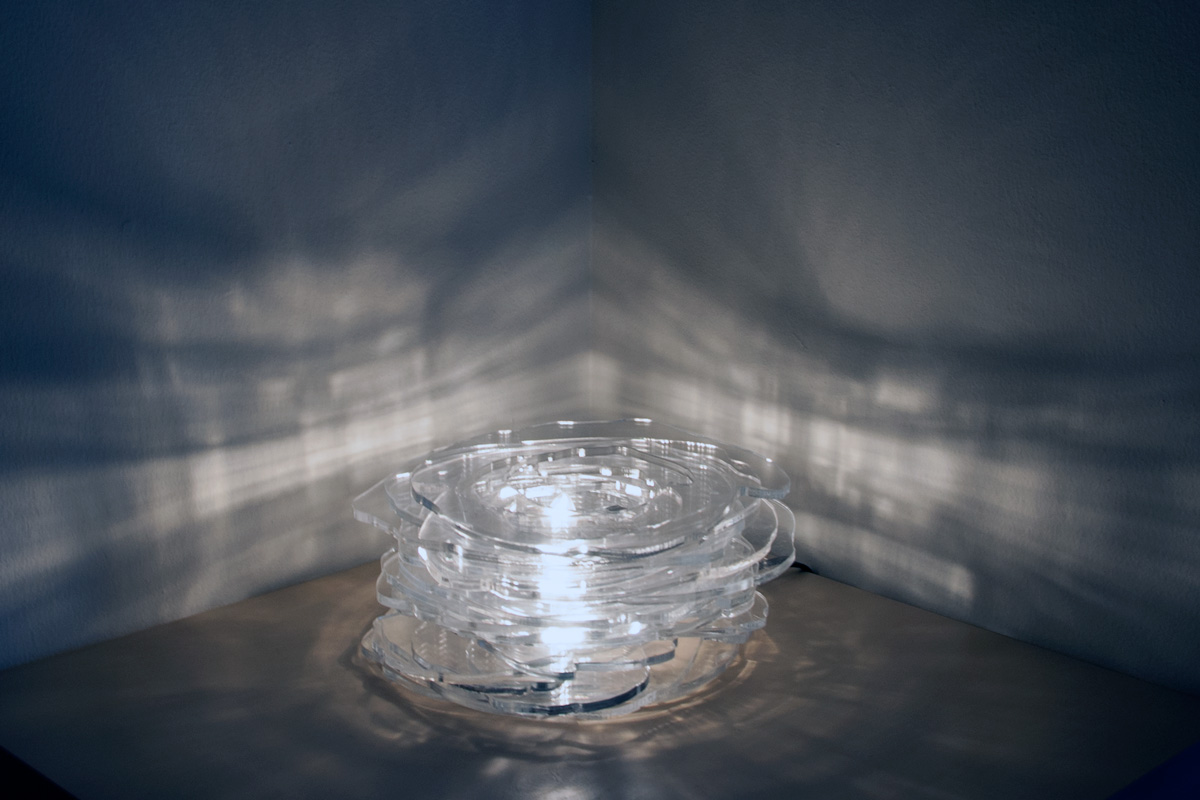

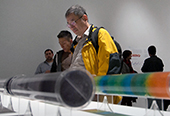
04 INSTALLATION VIEW -


05 REFLECTIONS -
The most challenging part of the project is to how to transform all the data into a physical visualization. What kind of data use, as well as the equations that would be used to create the visualizations.