


01 PROJECT DESCRIPTION -
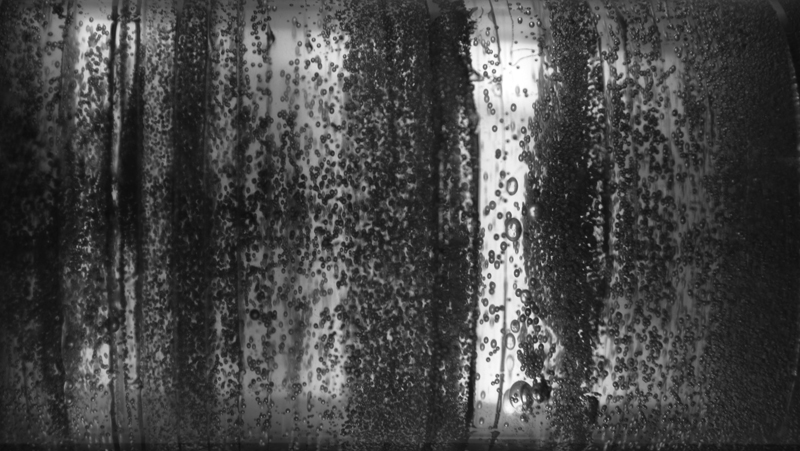
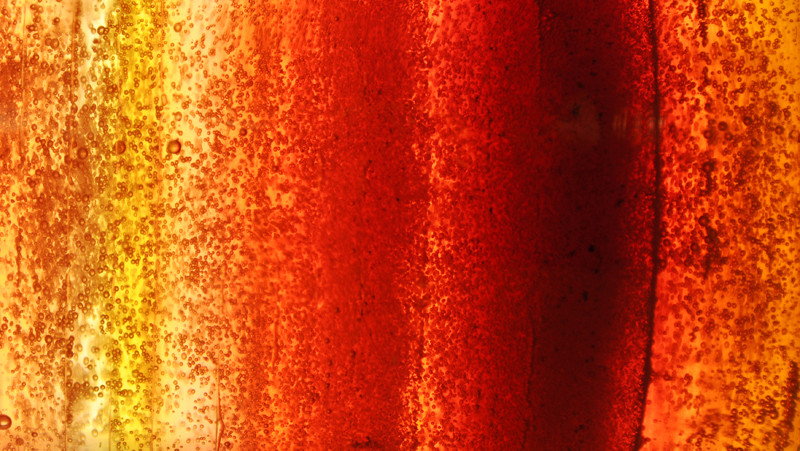
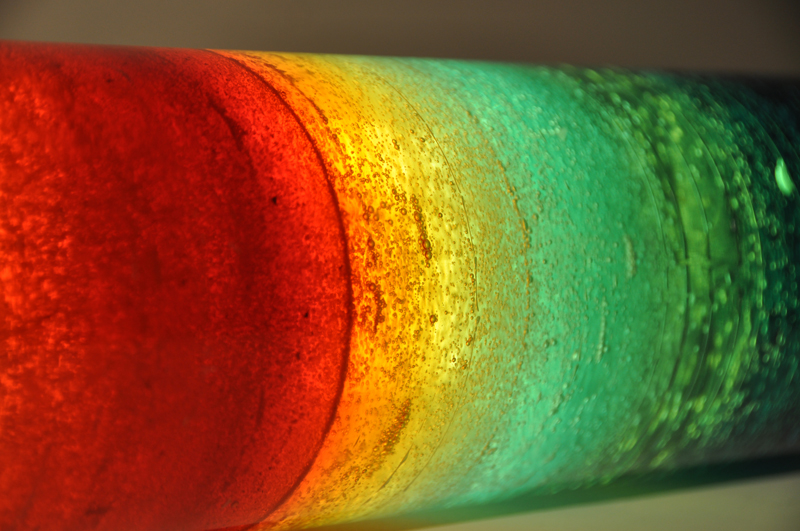
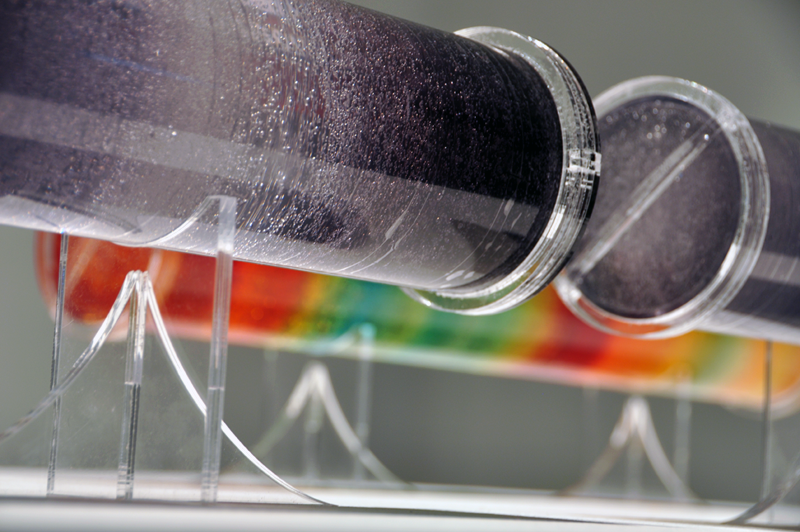
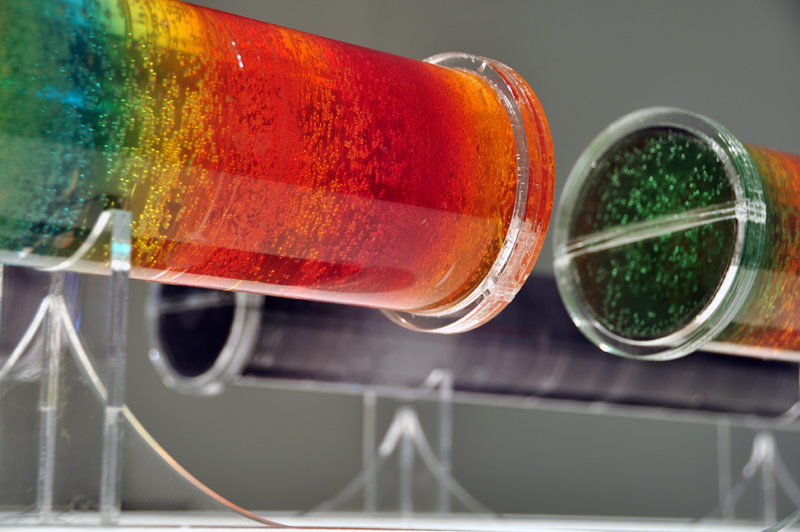
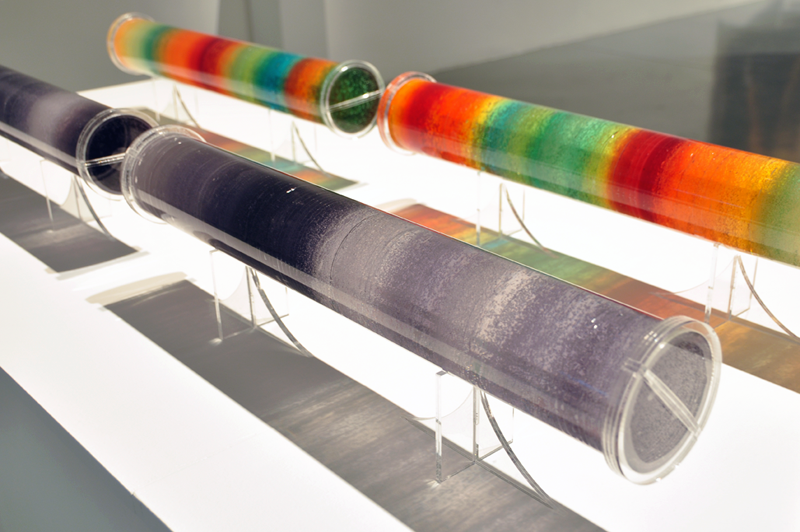
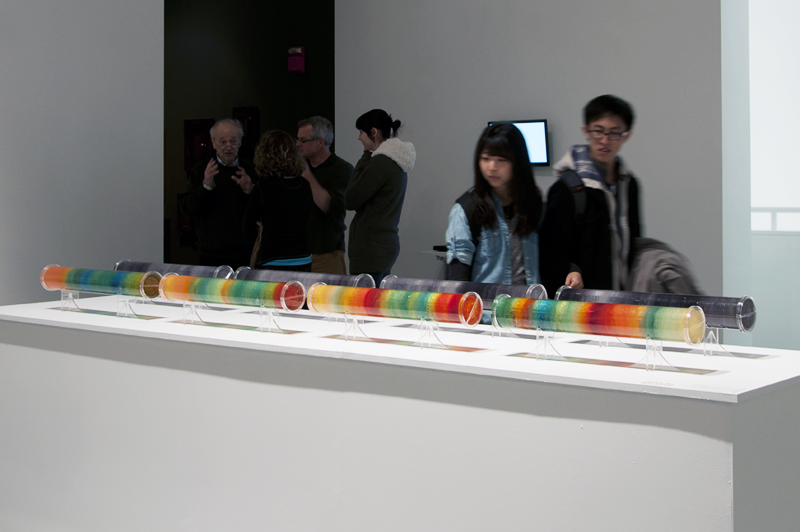
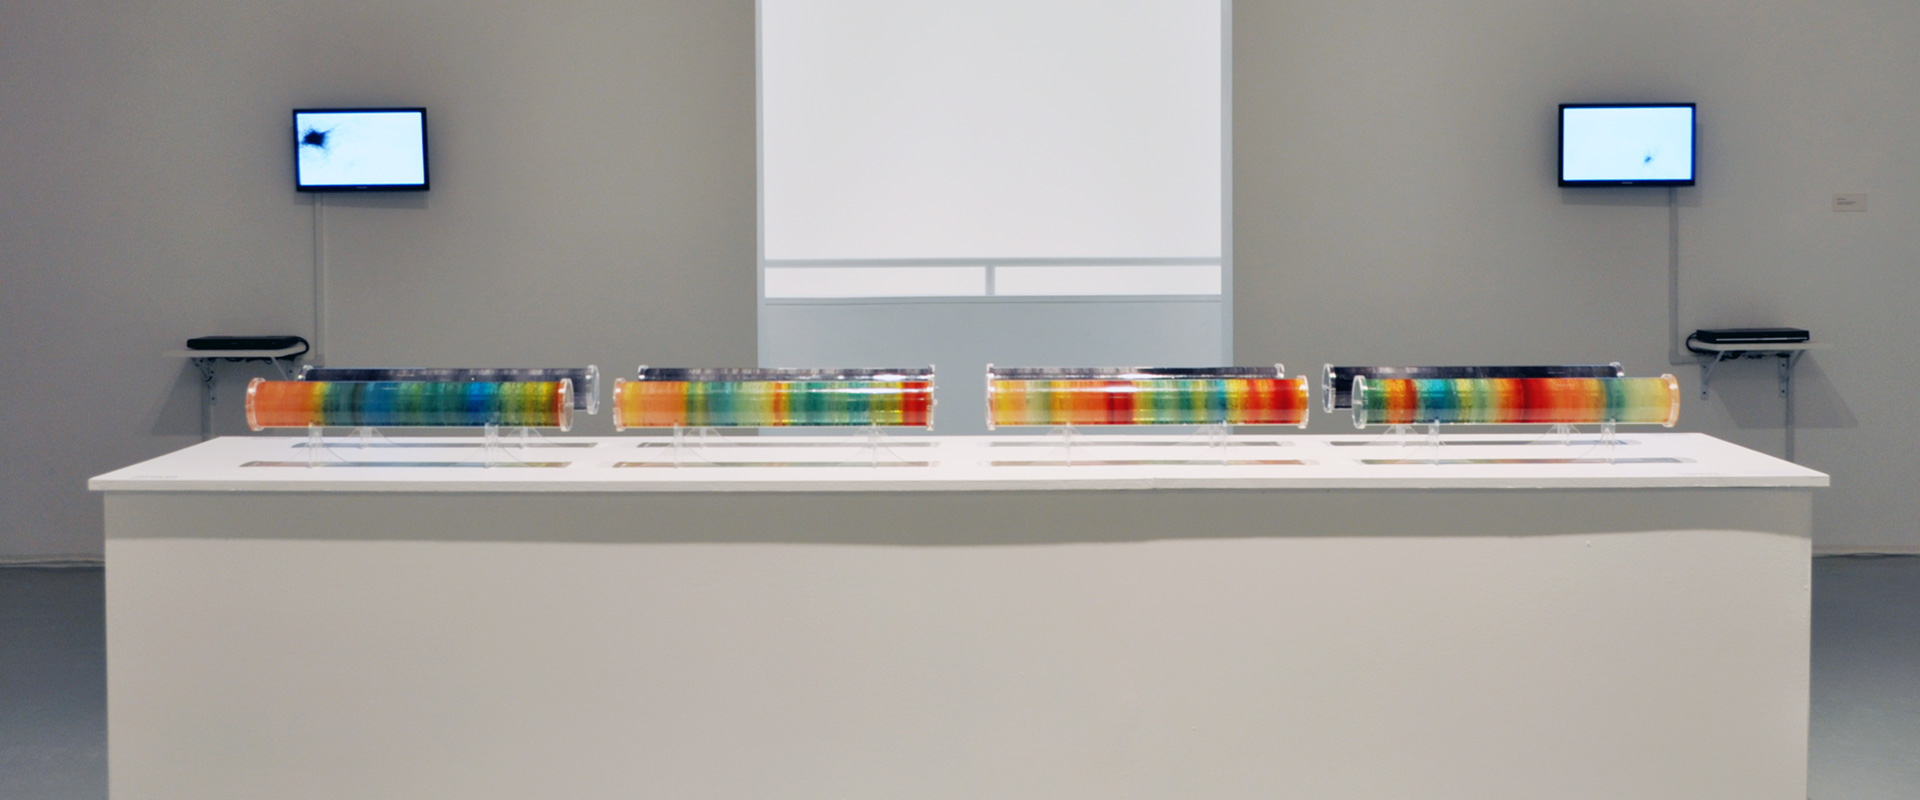
“Ice Core” brings together the aesthetics of layers of ice with the immense amount of weather information core samples contain. It features eight acrylic tubes filled with layered gel wax, with each layer denoting the average data contained within a thousand-year sample. The grayscale tubes indicate the different carbon dioxide levels in the ice core layers. The darker the layer of wax, the more carbon dioxide that was produced during a particular thousand years. The colored tubes demonstrate temperature variation by using the colors associated with a standard weather map. For example, red denotes the highest temperature and blue indicates the lowest temperature. These tubes, shown side by side, provide an insightful comparison between carbon dioxide level in relationship to global temperature changes during the last four hundred thousand years.
02 DESIGN PROCESSES -
Ice cores are long and condensed tubes that are extracted from the extremely cold areas where snow fell and accumulated over the years with minimal melting and eventually compressed to ice sheets. The layers of snow contain rich information about our global climate. For example, dust, ash, pollen, bubbles of atmospheric gas and radioactive substances. This project is particularly concerned with carbon dioxide content in the gaseous bubbles trapped inside each layer of ice. Below is a sample image of ice core extracted from Greenland.


(Photograph) courtesy of the U.S. Geological Survey
First the data set is obtained from NOAA - National Oceanic and Atmospheric Administration. Below shows the data set used in diagram format based on the Vostok Petit data. Carbon dioxide in comparison of global temperature variation is chosen. Generally carbon dioxide production is related to burning of carbon and other energy consumption activities. While global warming is closely related to the amount of greenhouse gases in the atmosphere especially carbon dioxide level.


Therefore, I was brainstorming along the line of creating something that is semi-transparent which lends close resemblance to original ice cores and gives the flexibility of making it layer by layer. Therefore, the process of making wax candle came in really handy. Hence, layers of wax are melted with the measured amount of dye is poured into the tube layer by layer. Given the size consideration of the usual ice core that is subtracted from the glacier, I divided the acrylic tube into four sections given that there are four hundred thousand years. Each tube represents a hundred thousand years. Further dividing each tube into a hundred layers, therefore each layer of the wax represent average data over a thousand years. The amount of dye is calculated to carefully counted about the drops that is put into over the course of making the layers to make it more accurate.
03 DELIVERABLES -
A greyscale color scheme is used to depict the carbon dioxide variation over the last four hundred thousand years. In comparison, temperature is shown with color selection based on the weather map that people usually are familiar with. Red is associated with heat or hot temperature and blue indicates freezing temperature. Therefore, another four tubes are made in relation to the other four grey scale ones. When they are shown side by side, we can see that the variation corresponds. When more carbon dioxide is present in the global environment, the hotter the climate, and higher the temperature. Inversely, the lighter content indicates a lower carbon dioxide production and therefore followed by a generally colder temperature.


A very interesting aspect of this making is the tactility of the whole process. I wanted the audience to have a direct correlation to what they see in front of them and appreciate the beauty of the ice core as I have been. Also, it is observed that there are four general cycles in terms of variation of the global climate. Currently, according to the trend, we are moving towards the time period that temperature is predicted to go up. Therefore it lends question to that if global warming is a manmade phenomenon or it is part of the global climate change cycle.


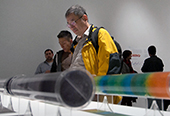
04 INSTALLATION VIEW -


05 REFLECTIONS -
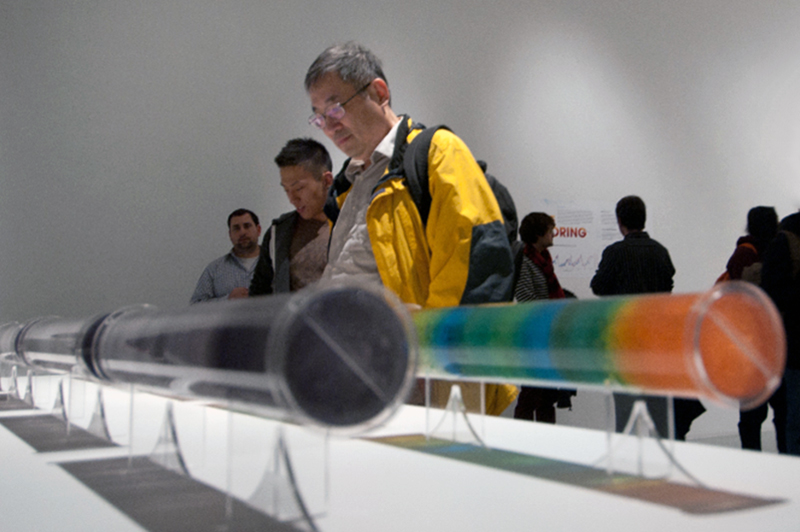
This project opens a lot of possibilities for me and I have explored the option of exploring data visualization through material and construction. The sculptural aspect of the project is especially important as I observe people who come to the show and stand close up to the tubes and observe the bubbles and layers of the sculpture. A lot of them told me the close resemblance is definitely very helpful in terms of understanding the complex data behind the project.